About Me
Hello! My name is Aaron Hurtado. Scroll down to read and learn more about me!
I am a Software Engineer with over 5 years of experience in building and optimizing large-scale systems, including a healthcare analytics engine serving 10 million daily users and a U.S. Navy combat defense system. I am an expert in multiple programming languages, including C++, Python, Java, and cloud technologies like AWS, with a track record of automating processes and enhancing system performance. I am passionate about tackling complex challenges, demonstrated through personal projects such as my cryptocurrency trading bot (which you can read more about in the Projects section of this website). I am eager to apply my technical expertise and problem-solving skills to deliver impactful solutions to meaningful future projects.
Technical Skills
-
Programming Languages:
Java, C, C++, Python, C#, JavaScript, Bash, YAML, OCaml, SPARC Assembly -
Frontend:
React, HTML, CSS -
Backend:
Node.js, Django -
Cloud Platforms:
AWS, Heroku -
Databases:
SQL, NoSQL, MongoDB, PostgreSQL, Redis, SQLite, MySQL -
DevOps & CI/CD:
Git, Docker, Gitlab, Github, Jenkins, Bitbucket -
Testing & Debugging:
Junit, Selenium, Pytest, Valgrind, GDB -
Project Management:
Jira, Confluence, Trello, Agile, Scrum, Kanban -
Platforms:
Linux, Windows, macOS -
Software & Development Tools:
- Build Tools: Ninja, Parcel, Maven, Apache Ant, Makefiles
- Compilers: Clang
- Editors/IDEs: Vim, Visual Studio Code, Eclipse, Cursor
- Virtualization: Virtual Machines, VirtualBox, VMware
- Networking: WireShark, Zeek (formerly Bro)
- Headless Browsers: ChromeDriver, Selenium WebDriver, PhantomJS, CasperJS
- Documentation/Publishing: LaTeX, UML, Microsoft Office (Word, Excel, PowerPoint)

Education
University of California, San Diego


Bachelor of Science (B.S.)
Class of 2017
Degree: Computer Science
From the fall of 2013 to the spring of 2017 I attended the University of California, San Diego where I learned to program and the art of Software Engineering.
During my time at UCSD, I learned everything from object-oriented programming and software design patterns to data structures and algorithms. I did the majority of my class work in Java, C++, and Python which are my main languages. During my time as a student I also worked as a tutor for the UCSD CSE department for several quarters. I tutored both lower and upper division data structure courses.
A huge part of my time at UCSD was being accepted into the Early Research Scholars Program (ERSP) by the CSE department. I applied to the program the first year it was created and was one of 23 undergraduate students accepted into the program. The main purpose of the program was to expose and get undergraduate students involved in Computer Science Research which is typically done by graduate students and professors.
As a result of the ERSP program, I spent three years working alongside graduate students and professors on their research projects in the Systems and Networking Research Group as well as the Security and Cryptography Research Group. The professors I worked with, who were the heads of the aforementioned research groups, were Stefan Savage and Geoffrey Voelker. You can read about the projects I worked on while in this program in the Projects section of this website. You can also learn more about the ERSP program by visiting the ERSP website.

Professional Experience
Centene Corporation
Position: Senior Software Engineer
–
Position: Software Engineer
–
Location: San Diego, CA
Overview
I worked for Centene Corporation, a Fortune 500 company that provides healthcare solutions to individuals and families. I was a full-time software engineer and was later promoted to be a senior software engineer for excellent programming, engineering, and collaboration performance. I was a primary member of the backend healthcare analytics engine team that developed and certified measures (including HEDIS, AMP, CMS, Risk Adjustment, and custom) for a large-scale production system that generated alerts for 10 million members daily.
Key Technologies Used:
- C++
- MongoDB
- AWS
- Docker
- Linux
- Jenkins
- GitLab
- Python
- Ninja
- Clang
Background Information: What are HEDIS measures?
HEDIS measures are a set of standardized metrics used to evaluate the quality of healthcare services. They are used by healthcare organizations to monitor and improve the quality of care they provide. It is a gold standard in healthcare performance measurement, used by over 90% of health plans in the US.
HEDIS measures are created and managed by the National Committee for Quality Assurance (NCQA). NCQA is an independent nonprofit organization in the United States that works to improve health care quality through the administration of evidence-based standards, measures, programs, and accreditation. HEDIS includes over 90 clinical measures across six domains: effectiveness, access, experience, utilization, descriptive information, and electronic systems. HEDIS data is collected through surveys, medical charts and insurance claims for hospitalizations, medical office visits and procedures.
You can actually look up the rating of your healthcare plan on the NCQA Health Plan Report Card website.

Backend Engine Overview
To calculate the scores for HEDIS measures, we used our backend engine which was built in C++. You would give the engine a list of measures and a set of members from a certain population data set. Then, for each member, the engine would iterate over all of their health-care data from our database (e.g. medical charts, insurance claims, medical office visits, and procedures). Next, it would run all of their data through the list of specified measures and depending on the measure give them a pass/fail score. Some measures would output a numerical score based on certain criteria and calculations. Lastly, we would output all of the results in a JSON format which was then consumed and analyzed by our API team.
Example HEDIS Measures
- Lead Screening in Children (LSC): The percentage of children 2 years of age who had one or more capillary or venous lead blood test for lead poisoning by their second birthday.
- Breast Cancer Screening (BCS): assesses women 50–74 years of age who had at least one mammogram to screen for breast cancer in the past two years.
- Annual Dental Visit (ADV): Assesses Medicaid members 2–20 years of age with dental benefits, who had at least one dental visit during the year.
What I did
On an annual basis NCQA adds, deletes, and revises the HEDIS measures. As a member of the backend healthcare analytics engine team, I was responsible for updating the codebase (C++) to implement new and revised measures. Afterwards, our Quality Assurance (QA) team would review the changes and ensure that the measures were implemented correctly. If any bugs or issues were found, I would work with the QA team to fix them.
Every year NCQA published a large Technical Specifications document that contained all of the HEDIS measures and their specifications. This document was used as a reference for implementing the measures in our codebase. My task would be to read through the document and write code (C++) to implement the measures according to their specifications. Above is an image showing a simplified example of what the Technical Specifications document looked like.
In addition to HEDIS measures, I also worked on CMS measures. CMS measures are used to assure and evaluate quality health care for Medicare and Medicaid Beneficiaries. Furthermore, some states would have their own custom measures that we would need to implement and maintain.
Projects
An example of a project I worked on was to refactor our core engine's output. I worked with one of the VPs who wanted more insight into how our scores for measures were being calculated. Specifically, he wanted to know exactly which health-care codes were being used to evaluate our scores. Thus I had to refactor our engine's code to store and output a list of all health-care codes that were used to compute the scores for each member.
Another project I worked on was to create a tool that would convert all of our health-care data for members from a plain text format to a YAML format. My manager was a big fan of YAML and he wanted to update the codebase to use it. Thus, I developed a C++ program that would read in our plain text data, convert it to YAML, and output it in the new format. Once I finished the program, I successfully ran it and converted all of our data into YAML.
Our team used Confluence to create and maintain our technical documentation. In my downtime, I wrote and contributed a copious amount of documentation to our Confluence pages. This documentation helped our team and future engineers understand the codebase and the logic behind the code.
Became Owner of Risk Adjusted measures codebase
During my time at Centene, I became owner of a significant portion of our codebase that was left abandoned when a previous engineer left the company. This was a great opportunity for me to learn more about the codebase and to become a more senior engineer. Specifically, it was our entire section of Risk Adjusted measures that was left destitute.
NCQA uses risk-adjusted measures in HEDIS to assess health plan performance by accounting for differences in patient populations. These measures compare a plan's actual performance to an expected performance, factoring in variables like age, gender, and comorbidities. This allows for a more fair comparison between plans, as it adjusts for the inherent risks associated with different patient profiles. I was able to refactor these measures and bring them up to date with the latest standards of our codebase, restoring the lost functionality of these measures.

Epsilon Systems Solutions, Inc.
Position: Software Engineer
–
Location: San Diego, CA
Overview
My first professional job was at Epsilon Systems Solutions, Inc. Epsilon Systems is a small National Defense contractor that provides total life-cycle support to defense systems such as research, analysis, system architecture, engineering, software development, assembly and testing, and operational support. During my time here I worked as a full-time software engineer for the Navy SSDS program.
What is SSDS?
SSDS is the command and control system aboard amphibious ships and aircraft carriers. The Ship Self-Defense System (SSDS) is a combat system specifically designed for anti-air defense of aircraft carriers. Navy commanders depend on SSDS to effectively integrate their ship’s sensors and weapon systems to enable the timely engagement of a diverse spectrum of hostile air threats to their ship.
The SSDS program runs on a ten year contract basis. At the time of my employment, the program was under Raytheon (now known as RTX Corporation). My co-workers and I worked as sub-contractors for Raytheon alongside their employees to develop and maintain the software for the SSDS program.
As a software engineer, I contributed to all phases of the Software Development Life Cycle: planning, design, software development, testing, and maintenance. I developed code (C++) for the SSDS program on a Linux platform. While working on the project we used an Agile/Scrum development process.

Personal Projects
Cryptocurrency Trading Bot
Overview:
I created a cryptocurrency trading bot strategy using Python and the Freqtrade framework. The bot uses technical analysis indicators in order to make buy and sell decisions. It is is fully automated allowing it to trade 24/7 and works on popular cryptocurrency exchanges such as Binance and Coinbase. In backtesting, my strategy achieved a Compound Annual Growth Rate (CAGR) of 60.90% over a 4 year period (2021-2025), significantly outperforming the S&P 500's historical CAGR of ~10%.
Key Technologies Used:
- Python
- Freqtrade
- Pandas
- TA-Lib
- Docker
- Machine Learning - Hyperparameter Optimization
During the summer of 2022, I became extremely intrigued with the stock market and how to trade stocks. I dove deep into learning about investing and trading. I learned about Fundamental Analysis, Technical Analysis, and the investing philosophies of legendary investors such as Warren Buffett, Charlie Munger, and Peter Lynch. Investopedia quickly became one of my favorite websites!
As a software engineer, I wanted to incorporate my skills in software development with my newfound interest in stock trading. That was when I decided I wanted to challenge myself to build a trading bot.

What is Technical Analysis?
When it comes to stock market trading and investing there are two main schools of thought: Fundamental Analysis and Technical Analysis. Fundamental Analysis is the study of a company's financial statements, earnings, and other metrics to determine the fair value of their stock. This is the chief investing principle used by Warren Buffett and Charlie Munger. Fundamental analysts search for stocks trading at prices higher or lower than their real value.
Technical Analysis on the other hand is the study of a stock's price and volume data to predict future price movements in order to identify trading and investment opportunities. Technical analysts pretty much solely focus on analyzing stock charts to find patterns and trends that can then be used to make trading decisions. Unlike Fundamental Analysis, Technical Analysis is not concerned with the underlying fundamentals of a company. One of the main tools used by technical analysts are Technical Indicators.
Technical Indicators
Technical Indicators are mathematical heuristics and patterns based on the price and volume data of a stock. They use formulas and algorithms to derive meaningful insights from price action data. The most popular and commonly used technical indicators include MACD, RSI, Bollinger Bands, and Moving Averages. A fascinating property about technical indicators is that since they are math based, they work not just on stocks but on any asset that has price and volume data (including cryptocurrencies). In fact, they probably work better on cryptocurrencies than traditional stocks!

Why cryptocurrency?
So far I have mainly only mentioned the stock market. So why did I choose to build a trading bot for cryptocurrency? Well, there are a couple of reasons. One main reason is, since trading bots are computer programs, they have to rely on an algorithmic data based approach to trading which is why they primarily use technical indicators for their trading logic. As I mentioned earlier, technical indicators work great on cryptocurrencies. A second reason is, I wanted to challenge myself to build a trading bot for a new future-looking asset class. A huge benefit of trading cryptocurrencies is the fact that they are digital and can be traded anytime 24/7 unlike traditional stocks which are traded on a fixed schedule (business days from 9:30 AM to 4:00 PM EST). However, because technical indicators work on any asset that has price and volume, my bot's trading logic could be modified to trade traditional stocks.

Freqtrade
When I started researching trading bots, I quickly discovered Freqtrade. Freqtrade is a free and open-source Python based cryptocurrency trading bot framework. Freqtrade works on the main cryptocurrency exchanges like Binance, Kraken, and Coinbase. It allows you to download historical price and volume data for any cryptocurrency pair supported by the exchange. With this data, you can backtest your trading strategy and optimize your trading parameters. Backtesting is where Freqtrade runs a simulation of your trading strategy on historical data and presents you with the results of your strategy. Then once you are satisfied with your strategy, you can use Freqtrade to trade the cryptocurrency live in real time.

After reading the Freqtrade documentation, I started working on developing and implementing my own trading strategy. I studied and learned several technical indicators and tested how I could use them to create a profitable strategy. Thanks to backtesting, I could test my strategy on historical data and optimize my strategy. I became obsessed with finding the optimal strategy and spent countless hours continuously learning, testing, and improving my strategy. It was extremely fun and rewarding finding ways to make my strategy more and more profitable!
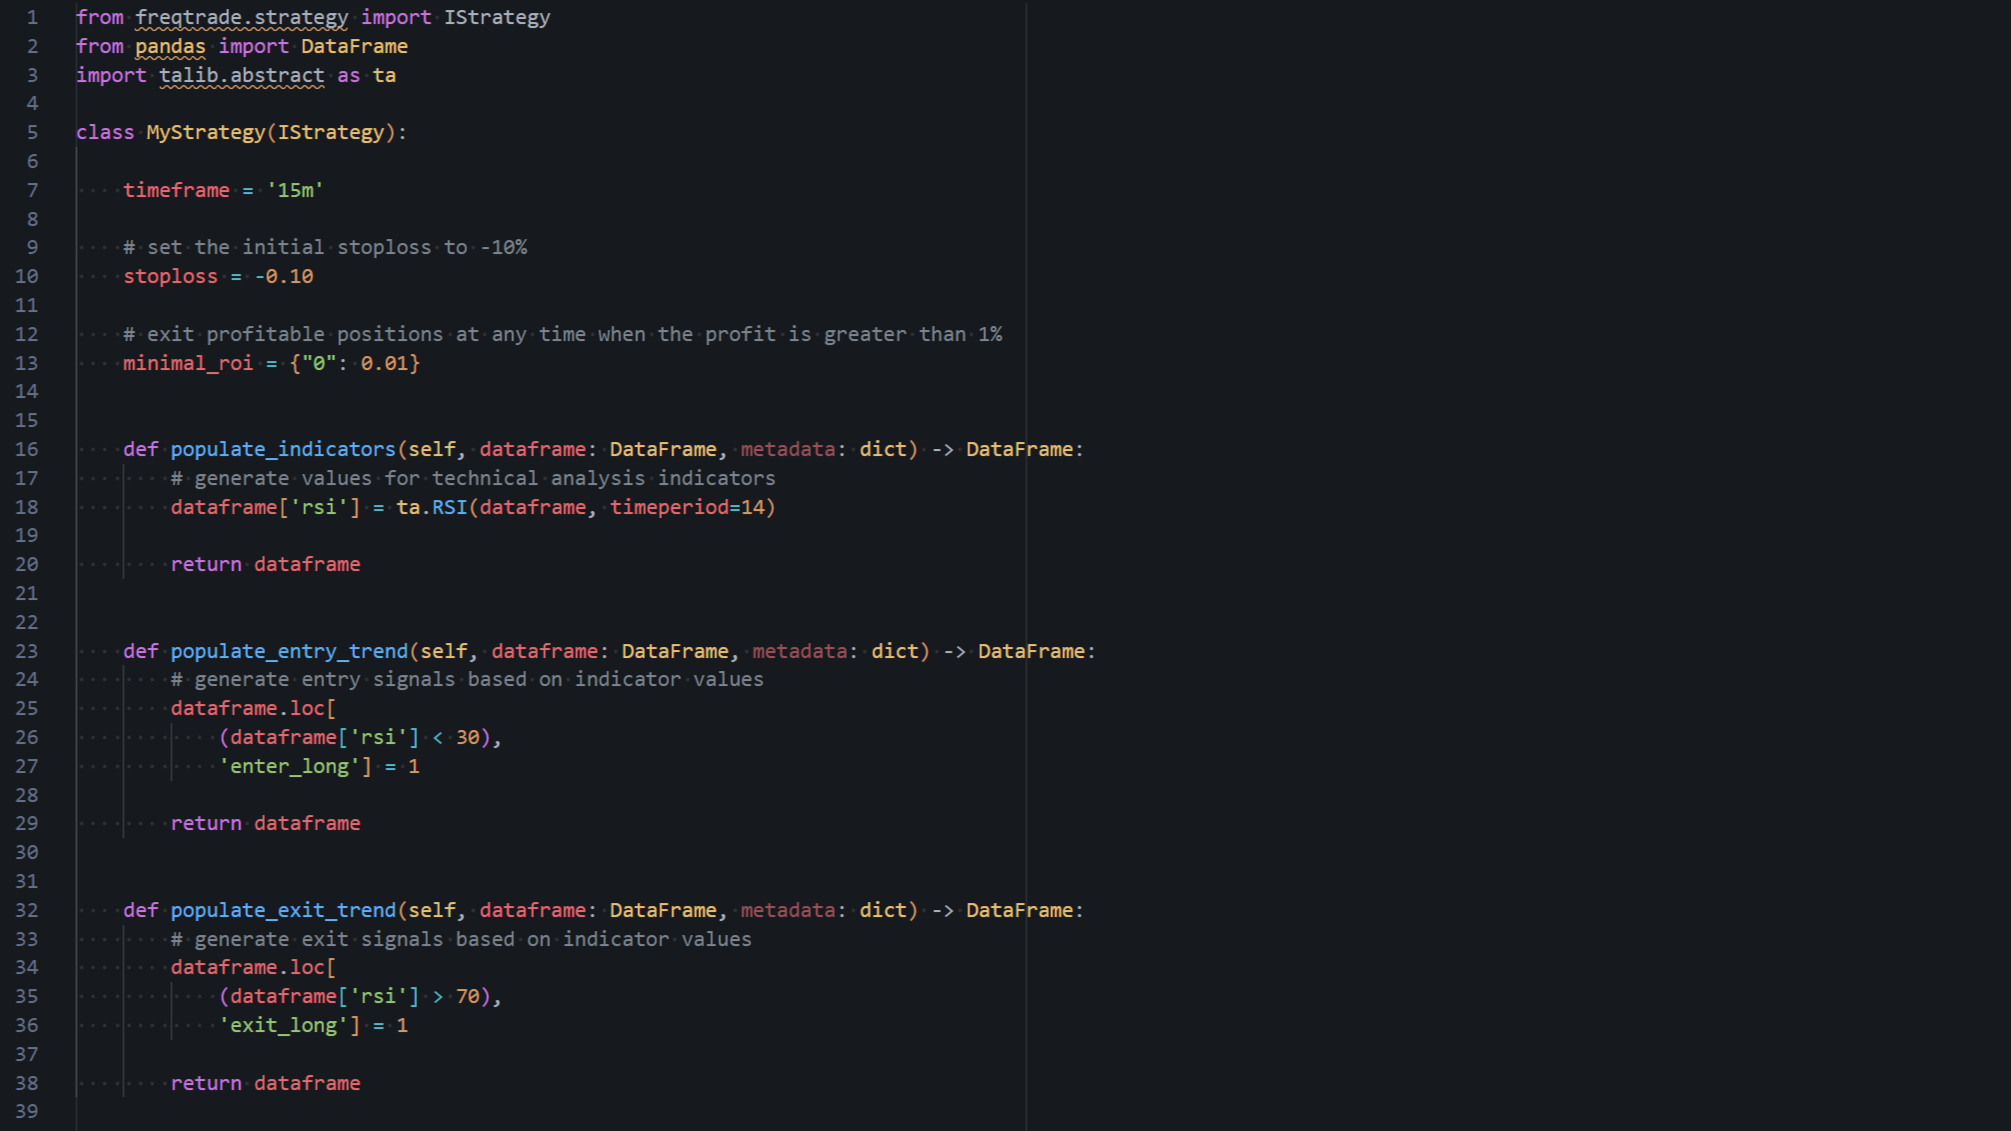
Example Freqtrade Strategy
Let us take a look at what a simple Freqtrade strategy looks like. In the image above, you can see the code for a minimal strategy. For background information, Freqtrade uses pandas to store and provide the candlestick data. Pandas is a great library developed for processing large amounts of data in tabular format. Each row in a dataframe corresponds to one candle on a chart and is made up of a six values: date, open, high, low, close and volume. The latest complete candle is always the last in the dataframe.
If we were to look at the first few rows of the main dataframe using the pandas head() function, we would see:
    > dataframe.head()
                           date      open      high       low     close     volume
    0 2021-11-09 23:25:00+00:00  67279.67  67321.84  67255.01  67300.97   44.62253
    1 2021-11-09 23:30:00+00:00  67300.97  67301.34  67183.03  67187.01   61.38076
    2 2021-11-09 23:35:00+00:00  67187.02  67187.02  67031.93  67123.81  113.42728
    3 2021-11-09 23:40:00+00:00  67123.80  67222.40  67080.33  67160.48   78.96008
    4 2021-11-09 23:45:00+00:00  67160.48  67160.48  66901.26  66943.37  111.39292
The timeframe variable determines what candle length the strategy will use (e.g. 15m, 1h, 4h, 1d etc.). Some people use short timeframes such as 15m or 1h while others use longer timeframes, for instance 8h or 1d.
On line 10 we set the stoploss for the strategy to be -10%. The stoploss parameter is a ratio that should trigger a sale. For example, the value -0.10 will cause an immediate sell if your profit dips below -10% for a given trade.
On line 13 setting the minimal_roi value to 0.01 means that the strategy will only sell a position if the profit is at least 1% above the initial entry price.
The populate_indicators function adds columns to the dataframe that represent the technical analysis indicator values. Technical analysis functions analyze the candle data using the technical indicator of your choice and then we can store the result in a new column in the dataframe. In line 18 we use ta-lib's RSI function ta.RSI(), and assign the result to a column named rsi.
RSI is a very popular technical indicator that measures the speed and magnitude of price movements to detect overbought or oversold conditions. RSI values range from 0 to 100. A value above 70 is considered overbought while a value below 30 is considered oversold.
The purpose of the populate_entry_trend function is to define conditions for an entry signal (i.e. when to buy). We accomplish this by assigning a value of 1 to the dataframe column enter_long when the conditions we are looking for are met. The term long means to buy a cryptocurrency and aim to sell it at a higher price for a profit. When freqtrade encounters an entry signal, it will attempt to make a buy order. In the example code above, we assign a long entry signal whenever the RSI value is below 30.
Similarly, the populate_exit_trend function defines conditions for an exit signal (i.e. when to sell). In the sample strategy, we look to exit our trade whenever the RSI value is above 70 which typically indicates that the price of the cryptocurrency is overbought and it is time to sell.
Machine Learning Optimization
Freqtrade has a feature that allows you to optimize your strategy using machine learning, using a process called Hyperparameter Optimization. First, you need to define a search space for the parameters you want to optimize. You can choose to optimize your buy, sell, stoploss, or other parameters. Second, you need to specify a range of values for each parameter. For example, if you want to test if your strategy performs better with a stoploss of 10% or 20%, you would specify a range of 10%-20% for the stoploss parameter. Once you have all of your parameters and their ranges defined, you can run the optimization process.
The optimization process is a trial and error process where the bot will try different parameters and see which ones have the best performance. In general, the search for best parameters starts with a few random combinations and then uses Bayesian search with a ML regressor algorithm to quickly find a combination of parameters that perform the best. Depending on the size of your search space, the optimization process can take a while to complete. Afterwards, the program will output the best parameters it found and the results of the optimized strategy.
My Freqtrade Strategy
Eventually, I was able to create a strategy that I was satisfied with. Let us take a look at the results!

In case you are wondering what all of these terms mean, here are some of their definitions so we have a better understanding of the results.
Definitions
-
CAGR:
The Compound Annual Growth Rate (CAGR) is a financial metric that measures the annual growth rate of an investment or portfolio over a specified period, assuming the returns are reinvested (compounded) each year. It provides a smoothed, annualized return that reflects the growth as if it occurred at a steady rate, making it useful for comparing the performance of different investments or strategies. It’s ideal for summarizing long-term performance. The S&P 500 has a historical CAGR of ~10% per year.
-
Sortino:
The Sortino ratio is a financial metric used to evaluate the risk-adjusted return of an investment or trading strategy, similar to the Sharpe ratio, but with a key difference: it focuses only on downside risk (negative returns or losses) rather than total volatility. This makes it particularly relevant for highlighting how well a strategy manages unfavorable outcomes, which is critical in volatile markets like cryptocurrencies. A higher Sortino ratio indicates better risk-adjusted returns relative to downside risk.
-
Sharpe:
The Sharpe ratio is a financial metric used to measure the risk-adjusted return of an investment or trading strategy. It shows how much return an investment generates per unit of risk taken, helping compare strategies or portfolios by accounting for volatility.
-
Calmar:
The Calmar ratio is a financial metric used to evaluate the risk-adjusted return of an investment or trading strategy by comparing its annualized return to its maximum drawdown (the largest peak-to-trough decline in portfolio value). It highlights how well a strategy delivers returns relative to the worst-case loss. A higher Calmar ratio indicates better returns per unit of maximum loss.
-
SQN:
The SQN (System Quality Number) is a performance metric developed by Dr. Van K. Tharp to evaluate the quality of a trading system or strategy by measuring the consistency and profitability of its returns relative to the variability of those returns. SQN evaluates how predictable and reliable a trading system’s returns are. A high SQN indicates consistent profits with low variability. Negative SQN values suggest a losing strategy.
-
Profit Factor:
The Profit Factor is a performance metric that measures the efficiency of a trading strategy by comparing the total gross profits from winning trades to the total gross losses from losing trades. It indicates how many times the profits cover the losses, providing a clear view of the strategy’s ability to generate gains relative to its risks.
-
Expectancy (ratio):
The Expectancy Ratio is a metric that measures the average expected profit per trade relative to the risk taken in each trade, expressed as a multiple of the risk (often denoted as "R"). It’s derived from the Expectancy, which quantifies the average dollar amount you expect to gain (or lose) per trade based on your strategy’s win rate, average win, and average loss. The Expectancy Ratio provides a normalized view of profitability per unit of risk, making it useful for evaluating the efficiency of a trading strategy. A high ratio indicates effective risk management, as losses are minimized while gains are maximized.
Backtesting Period:
At the time of this writing, I backtested my strategy on BTC (Bitcoin) from the dates of January 1st, 2021 to March 25th, 2025. Why did I start the backtesting since January 2021 when Bitcoin has been around since 2009? The exchange I am using only provides historical data for Bitcoin starting from 2019-09-23. Furthermore, the technical indicators I use require a certain amount of data to start producing their signals. Thus, I chose January 2021 as the start date of my backtesting period.
Results Overview:
I set the bot to start with a trading balance of $10,000 USDT which is a cryptocurrency stablecoin pegged to the US Dollar (the exchange I am using does not support normal USD). Looking at the results you can see my trading strategy ended with a balance of $74,781 over a period of about 4 years resulting in a total profit of $64,781. That is a 647% return on investment!
My strategy had a CAGR of 60.90% which significantly outperforms the S&P 500's historical CAGR of ~10% per year. Another highlight is the 2.06 Sortino ratio and 6.92 Calmar ratio which shows that my strategy is able to generate high returns with robust downside risk management. Additionally, the profit factor of 38.21 and an expectancy ratio of 7.44, demonstrate both profitable and efficient risk-adjusted returns.

PS5 Purchasing Bot
Overview:
During the holiday season of 2020, myself and a small community of developers came together to create a bot that would automatically purchase a PlayStation 5 (PS5) from online retailers. This project was in response to the global shortage of PS5s caused by the COVID-19 pandemic and the actions of scalpers who were using bots to buy up all of the available stock and reselling them at grossly inflated prices.
Main Development Tasks:
- Program the bot to navigate to a website and find the PS5 product page.
- Monitor the product page for stock availability.
- When the product became in stock, add it to the cart.
- Go through the complete checkout process and fill out all forms on the way.
- Handle any unexpected errors or interruptions that may occur.
- Fill out the payment information and successfully complete the purchase!
Key Technologies Used:
- Python
- PyQt5
- JavaScript
- ChromeDriver
- Selenium WebDriver
2020 was an interesting year to say the least. The COVID-19 pandemic was in full swing and the world was in a state of uncertainty. In particular, the pandemic caused a global shortage of semiconductors which affected the production of many products, including the PlayStation 5.
The long awaited PlayStation 5 launched on November 12, 2020. The launch was highly anticipated but unfortunately, the launch was faced with unprecedented challenges due to global supply chain disruptions and high demand from gamers. This combination of unfortunate circumstances led to massive widespread stock shortages.
Scalpers and resellers quickly took advantage of the situation and started buying up all of the available PS5s using bots and sold them for huge profits on eBay and other platforms. For example, the PS5 launched with a retail price of $499.99 but scalpers were selling them for over $1,000!
The limited supply of PS5s and the actions of scalpers made it nearly impossible for the average gamer to simply purchase a PS5. Several of my friends were victims of this unfortunate situation and were unable to purchase a PS5 for themselves.

Knowing that I am a software engineer, my friends asked me if I knew of any possible solution to this mess of a situation. This led me to researching the problem and I came across a small community of people who were developing their own bot to purchase PS5s. To quote the GitHub repo:
"Phoenix Bot is inspired by Natewong1313's Bird Bot project yet due to lack of activity by their team. We have decided to revive this project to achieve a common goal. Due to the recent insurgence of botters/scalpers taking advantage, our goal is to enable everyone the ability to combat these botters/scalpers by implementing their own botting system."
I was intrigued by the project so I joined their Discord server and quickly became a contributor to the project. Members of the community ranged from normal gamers to people learning to code as well as some experienced software engineers. We were a group of complete strangers but yet we came together to solve a common problem we all had - how to purchase a PS5.

The codebase was written in Python and used PyQt5 for the UI. Above is an image of the user interface. We also used ChromeDriver and Selenium WebDriver to power the web browser automation. Now as a reminder, the PS5 was launched in November which meant there was a huge amount of pressure to purchase one before the holidays. Parents wanted to buy one for their kids and some simply wanted to purchase one for themselves. Consequently, the entire community was extremely motivated and determined to achieve success with our Phoenix Bot.
Together as a group, we all contributed our knowledge and expertise. Luckily, some of us were educated in software development and website design. The lead developer of the project was a software engineer who was quite knowledgeable about web development and APIs. We quickly split up the work and each of us applied our skills to different parts of the project. Some worked on the UI, some worked on the purchasing logic, and some provided information about when which websites were planning to release stock online.

We focused on developing the bot to work on the main online retailers since they were likely to have the most available stock. The main sites we worked on were Amazon, Best Buy, GameStop, Target, and Walmart. I took on the task of engineering the bot to work on GameStop and Target.
On nights and weekends, I was dedicated to working on the bot. We had to make the bot fast, we had to make it reliable, we had to make it efficient, and most importantly, we had to make it work.
Step by step we started implementing key functionality of the bot. Day by day we became closer and closer to achieving our shared goal. During the development process, PS5s would be released online and some of us would try to purchase one manually themselves. Unfortunately, scalpers and their bots were still running rampant making it nearly impossible to be triumphant. Some members of the community were able to purchase one manually but it was still a rare occurrence. Our goal of making it possible for all of us to successfully purchase a PS5 was still yet to be achieved.
Eventually, we implemented the majority of the key features of the bot. We figured out how to program the bot to navigate websites, monitor product pages, add items to the cart, and fill out forms. It was a great feeling seeing the bot become more and more functional! It was awesome being able to run the bot and watch it work as it filled out forms and go through the checkout process. We made sure to do extensive testing because it was critical that the bot worked as expected when the time came to attempt to purchase a PS5.
However, not everything went smoothly. Retailers started to add anti-bot measures to their websites to prevent scalpers from purchasing PS5s. This was a benefit to the average consumer but it made our job more difficult. Not only did we have to compete against bots by the scalpers but now we had to figure out how to bypass the retailers' anti-bot measures!
For instance, an easy way to detect a bot is to check how fast the user is navigating and interacting with the website. If the user is navigating the website too fast, it is likely a bot. To combat this, we added a random delay between the actions the bot takes to make it seem more human-like.
Finally the time came where our bot was fully ready to be used. I finished implementing the bot to work on GameStop and Target. Now all that was left was to run the bot, wait for the PS5s to be released online, and hope everything worked as expected. We diligently researched when the retailers were planning to release stock online and kept up with latest rumors and news about PS5 availability. We would leave the bot running 24/7 and hoped for the best.
One night we had news Target was going to release stock sometime between 2:00am - 4:00am in the morning. Before I went to bed, I turned on the bot and set it to run on Target's website. In the morning when I woke up, I immediately jumped out of bed and rushed to my computer to see what had happened overnight. That was when I saw it, the final purchase confirmation screen of my very own PS5! The bot was a success!! All of our hard work and dedication finally paid off and I was able to enjoy the victory of my own hard work! It was a glorious moment and a moment I will always remember.
Day by day, more and more members of the community were successfully able to purchase a PS5 using our bot. It was a great feeling knowing that we were able to help so many people achieve their long awaited goal. Some members even shipped extra PS5s they bought to other members of the community to make sure as many of us as possible were able to get a PS5.
As time went on, thanks to our bot as well as PS5 availability becoming better, pretty much all of us were able to purchase a PS5. With our goal finally being achieved, we naturally no longer needed to work on the bot. Its purpose was accomplished and we were able to enjoy the fruits of our labor.

This Website
This website was created by me to showcase my experience, projects, and website/visual design skills. I wrote all of the code for this website myself from scratch (HTML, CSS, and JavaScript). Also uses Node.js and Parcel for bundling, optimization, and minification. I chose the design, layout, typography, and colors of the website. I did not use any pre-made templates, themes, or frameworks.
Notable Features:
- Web Responsive Design: I created the website to be fully responsive and adapt to different screen sizes by using automatically scaling font sizes and margins that maintain the layout of the website. If you are on a desktop computer, change the size of your browser window and watch the website adapt to the new size.
- Implemented a progress bar on the top navigation bar to show how far along the user is in the website.
- Created a side navigation bar that automatically updates to show the current section the user is at. (Disabled on mobile devices due to limited screen space)
- The side navigation bar disappears when you are at the top of the website looking at the banner image and reappears when you scroll down the page.
- Everytime you refresh the website, the banner image at the top of the page is randomly selected. Showcases pictures primarily featuring San Diego, CA.
- If you move your mouse over the main headings of the website (e.g. "Welcome", "Education"), a text shadow effect occurs.
- If you move your mouse over one of the images on the website, the image will have a slight pop-out effect.
- The image of Geisel Library during sunset in the Education section utilizes a parallax scrolling effect.
- If you move your mouse over the PS5 Pro image above or the image below of the GitHub repository for this website, the image will have a cool special effect!
- Some of the images on the website have built in links that will take you to relevant information when clicked on. If you click on the image below it will take you to the GitHub repository for this website.
- If you click on one of the headers in the Experience section or Projects section (e.g. "Centene Corporation" or "Cryptocurrency Trading Bot"), it will copy the link to that section to your clipboard.
- Uses Node.js for the backend and Parcel for bundling, optimization, and minification of the website's assets.
- Note: some of these features are disabled for mobile devices due to mobile browser limitations.
All of the code for this website is available to look at on my GitHub account. Just click on the GitHub icon in the top navigation bar or click on the image below to view the repository.

Undergraduate Projects
Research Project: Search + Seizure
During the summer after my first year at UCSD, I worked with a PhD student named David Wang and helped contribute to his research project. David was studying Black Hats (a term for malicious hackers) who were abusively manipulating search engine results to steer people towards fraudulent websites that sold counterfeit luxury goods (e.g. Louis Vuitton, Gucci, Versace, etc.). During his research, he identified 52 distinct search engine optimization (SEO) campaigns that were selling fake products of sixteen different luxury brands.
David created a web crawler to find these fraudulent websites and used it to keep a list of all the sites he found. He tasked me with the goal of developing a software program to document and collect information about these nefarious websites.
There were two mains reasons why David wanted me to collect information on these websites. First, to collect the order number when checking out a product in order to estimate their order volume. If the websites simply incremented their order numbers by 1 for each order, then we could use the order number to estimate their order volume over time and see how much business these websites were taking from the legitimate websites. Second, he wanted me to download the source files of the checkout pages in order to see which payment service providers these websites were using. This information could be used to report and disrupt the business of these fraudulent websites.
Main Development Tasks:
- The program must be able to navigate to each website in the list.
- The program must pick a product from the site and add it to the cart.
- Go through the complete checkout process and fill out all forms on the way.
- Take screenshots of every page of the website during the process.
- Download the source files (HTML, CSS, etc.) of every page of the website during the process.
- Automate the program to run once every day.
The first task was figuring out how to write a program to navigate to a website. After doing some research, I discovered I could use a headless browser to automate web tasks and scraping. A headless browser is a web browser without a graphical user interface (GUI) that can be controlled programmatically. The specific headless browser I ended up using was named CasperJS.
After I discovered CasperJS, I read the documentation and learned how to use it to accomplish every task I needed to implement. I was able to program it to navigate to a website, interact with elements on the page, fill out forms, take screenshots, and download the source files of each page. Afterwards, I learned how to use cron jobs to automate the program to run once every day.
The professors I worked with and David were very pleased with the results of my work. They especially liked the fact that the program could take screenshots of all of these fraudulent websites. This was a great experience for me because I was able to learn how a lot about web scraping and automation. The main technologies I used were JavaScript, CasperJS, Python, and cron jobs.
By the end of the summer, I had successfully completed the software program and had helped contribute to David's research project. He even thanked me for my work in his published research paper. The title of the research paper is "Search + Seizure: The Effectiveness of Interventions on SEO Campaigns" and you can read the full paper here on the UCSD Systems and Networking Research Group website.

Research Project: Network Traffic Analysis
Overview:
As mentioned in the Education section of this site, myself and three other undergraduate students worked with the Systems and Networking Research Group in the UCSD CSE department. The goal of the project we worked on was to analyze a user’s behavior in order to gauge the probability of their machine becoming compromised. In addition to us undergraduate students, we also worked with a PhD student named Louis DeKoven who helped guide and mentor us with our research project.
Background Information:
A compromised machine is one that has been infected with malware, viruses, or has been otherwise breached by an attacker. Over time the number of users on the Internet has grown drastically, especially with the rise of mobile smartphones and IoT (Internet of Things) devices. A result of this is that the number of compromised machines has also grown significantly as it has become easier for malware/viruses to spread themselves throughout the Internet's vast network of evergrowing devices.
Goals:
- Devise flags to identify risky behavior.
- Know what behavior raises a user's chance of becoming infected with malware.
- Know what behavior lowers a user's chance of becoming infected with malware.
- Predict the chance of a user's machine becoming compromised.
Key Technologies Used:
- Bro (Zeek)
- WireShark
- Python
Network Traffic:
Routers are devices that direct data packets between networks, connecting devices (e.g., computers, phones) to each other and most commonly to the Internet. Essentially, routers allow devices to be able to communicate with each other and are a core component of what enables the Internet to function. It is how a computer in your home can connect and communicate with a computer in another country.
By looking at a router's network traffic, we can see the data that is being sent and received by any devices on the network. This data can provide valuable insights into user behavior, such as which websites they visit, what applications they use, and how they interact with online services. By analyzing this data, we can identify patterns of behavior that may indicate risky or suspicious activity.
Bro:
As mentioned previously, a typical network can contain a multitude of devices all communicating with each other and to the Internet. In order to analyze the network traffic of a router, we needed a way to capture and analyze the vast amount of data packets being sent and received by the various devices on the network. This is where Bro comes in.
Bro is a network security monitoring platform and a domain specific programming language. Bro was renamed to Zeek in 2018. Below is a quote from the Zeek website that provides a brief overview of what Zeek is and its purpose.
Zeek has been a cornerstone of the open-source and cybersecurity communities for decades. Originally developed by Vern Paxson in the 1990s under the name “Bro,” Zeek was designed to provide deep insights into network activity across university and national lab networks. In 2018, the project was renamed Zeek to reflect its growing role and evolution in the world of network security. Today, Zeek remains a highly sought after open source solution thanks to the development and financial support of Corelight.
Unlike traditional security tools such as firewalls or intrusion prevention systems, Zeek is not an active defense mechanism. Instead, it operates quietly on a sensor—whether hardware, software, virtual, or cloud-based—analyzing network traffic in real-time. Zeek captures high-fidelity transaction logs, file contents, and customizable data outputs, which are ideal for manual review or integration into SIEM systems for security analysts.
Bro allowed us to monitor and log the specific network traffic we were interested in analyzing. The next task for us was to figure out what data we wanted to capture.
Network Signatures:
What is a network signature? A network signature is a unique pattern or characteristic of network traffic that can be used to identify specific types of behavior or activity. Network signatures can be used to detect malicious activity, for instance malware infections. They can also be used to identify normal user behavior such as browsing YouTube, listening to music on Spotify, or checking emails.
Our next major task was to design and develop our own set of network signatures to identify common user behavior. The first step for us was to use WireShark to record our own network traffic while we performed various activities on our computers. For example, we would record our network traffic while watching videos on Vimeo, listening to music on Pandora, or watching Netflix. We would then analyze the recorded network traffic in WireShark to identify patterns and heuristics of the network traffic that were unique to each activity.
After creating our own set of network signatures, we then wrote Bro scripts to implement our network signatures. The Bro scripts would analyze the network traffic monitored by Bro and apply our network signatures to identify and log the specific user behavior we were interested in. This allowed us to automate the process of identifying user activity based on their network traffic.
Testing:
The next major task was to test our network signatures and Bro scripts. First, we created controlled network traffic recordings where we knew what activities were being performed by a user on the network. We would then run our Bro scripts on the controlled network traffic recordings to see if our network signatures were able to accurately identify the user behavior we were looking for. This allowed us to validate and refine our network signatures and Bro scripts.
Second, we had Louis, our PhD student mentor, create his own set of network traffic recordings where he performed various activities (that were unknown to us) on his computer. We then ran our Bro scripts on his network traffic recordings to see if we could identify the user behavior he performed.
Conclusion/Results:
For the final phase of our research project, we had Louis record 48 hours of real network traffic from the UCSD Computer Science and Engineering department's network. This resulted in a vast amount of network traffic to analyze. We then ran our Bro scripts on the recorded network traffic to identify user network activity. The results were promising as our network signatures were indeed able to accurately identify a wide range of user behavior.
The results showed us how many devices during the 48 hour period used the following applications.
Results:
- Pandora: 10
- Vimeo: 20
- AIM: 0
- Viber: 2
- Netflix: 4
- Twitch: 7
At the conclusion of our research project, we were able to successfully create network signatures that identified a variety of user behavior based on their network traffic. This allowed us to take anonymous network traffic data and analyze it to gain insights into users and their application usage. From this project, I was able to learn a lot about computer networking, network traffic analysis, and how to use Bro (Zeek) and WireShark.
Below is an image for a poster board we created to present our research project. The poster board summarizes our research project and the results we found.
